Weekly Engine
Today we published a Bitcoin price forecast model for 2026-2031.This is essentially a five-year price target for BTC, based on a power law model adjusted for the structural compression that occurs after each halving.
GM/GN.
Today we published a Bitcoin price forecast model for 2026-2031.This is essentially a five-year price target for BTC, based on a power law model adjusted for the structural compression that occurs after each halving.
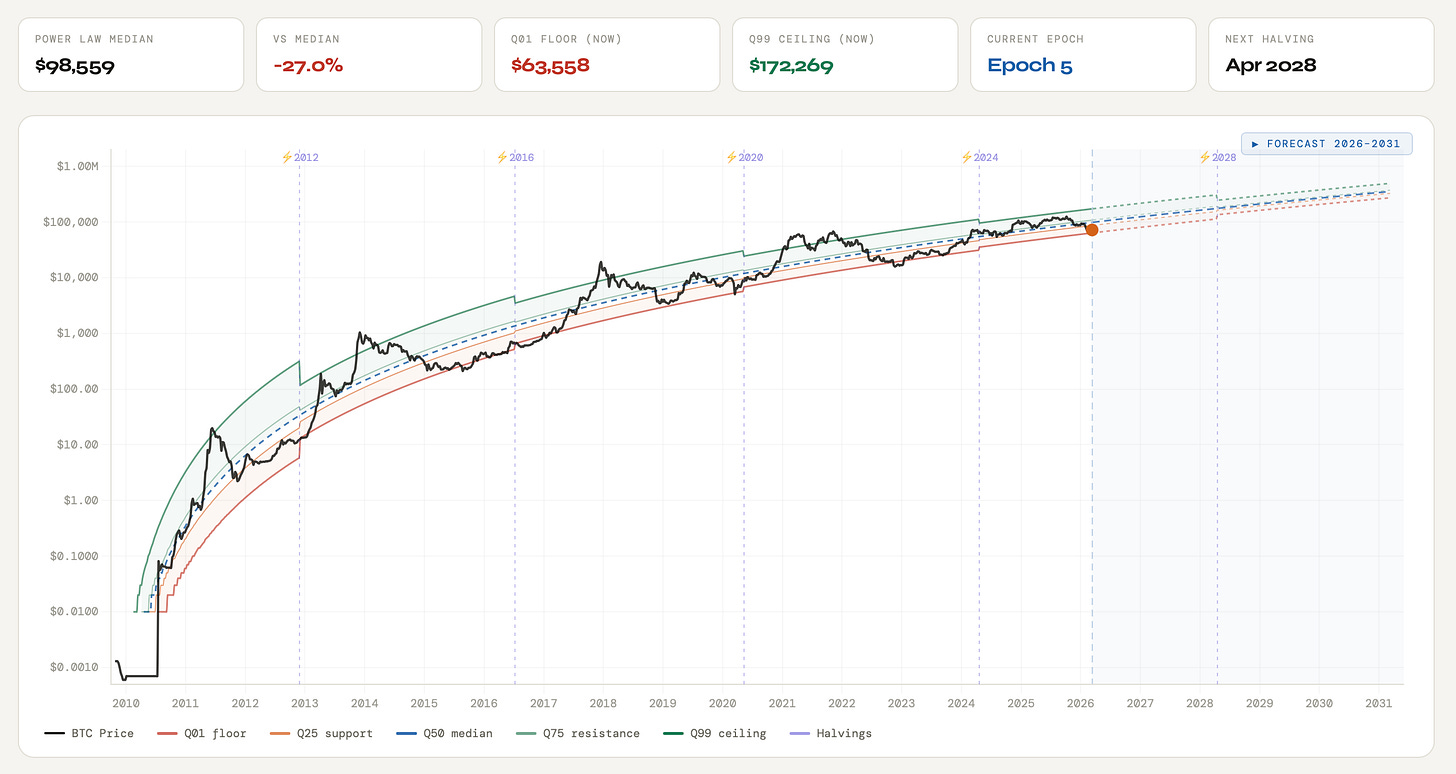
The chart is current price targets for the coming years.

I analyzed Bitcoin LTH Realized Supply. The metric remains at its maximum for this point in the cycle, and the structure increasingly resembles the late 2016 phase - when long-term holders still had room to accumulate. But the signals are mixed: Z-Score already reached 5.36 and pulled back to 2.66, the metric declined 5.5% from its peak, ROC 30d slowed to +7.6%. The next 30-60 days will give the answer - is this a pause before a new accumulation wave or the beginning of final redistribution.
Friday’s issue featured an update to the Bitcoin Sell-side Risk Ratio model - it is now adaptive. Currently, selling pressure in the market has dropped approximately 6x below the cyclical norm, which remains a generally positive signal for Bitcoin. The model shows more precise data compared to other metrics used in the Weekly Engine.

In connection with this, we updated our Core product and added this model to the main analytical layer for more accurate identification of panic selling phases and market stress. In the example below, the Weekly Engine already records a panic selling phase, but the stress label is not yet active. Once it activates, it will mean the market has transitioned from a panic phase to a stress phase and is beginning to digest the consequences of a large volume of panic selling.
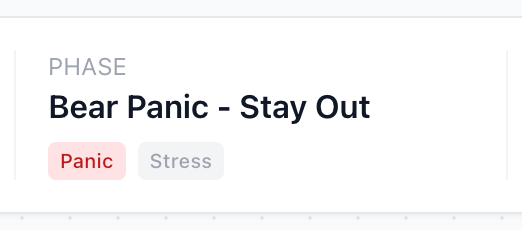
Weekly Decision Matrix
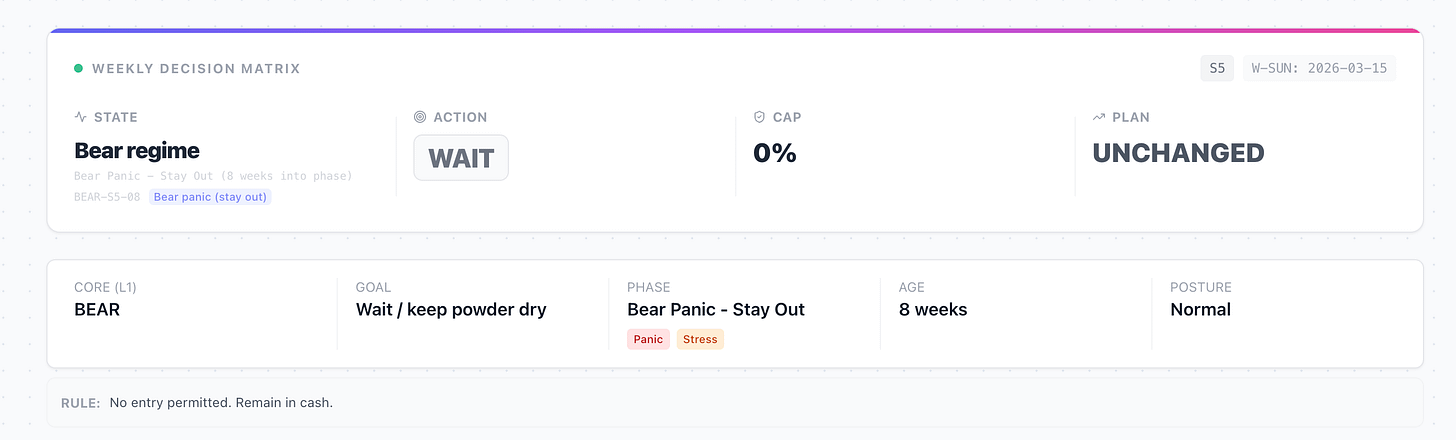
This week the strategy remains unchanged - position 0%, no new entries. The market is in abear stress phase following panic selling: conditions do not allow opening buys under the model’s rules. For the eighth consecutive week the decision remains unchanged - nothing new has occurred to revise the position. The trigger for a change will be the market exiting the current phase and a structural recovery signal appearing.
Trader’s Evidence (deep analytics)
Weekly Market Report: Bitcoin On-chain & DerivativesWeek close date: March 15, 2026ID: W-SUN 2026-03-15Reference price: $71,459Market Bias: BEARSTH-RP Status: BelowSTH Cost Basis: $91,071
On-chain Level Map
Active Support:$54,754 (Source: RP - Realized Price)Active Resistance:$91,071 (Source: STH-RP / STH Cost Basis)STH Cost Basis:$91,071LTH Cost Basis:$38,896Realized Price:$54,754
Level interpretation:The price of $71,459 remains significantly below the short-term holder cost basis (STH Cost Basis = $91,071), so that level retains its status as active resistance and a potential distribution zone on any rally. Over the week price gained 6.6%, however structurally nothing has changed - the distance to AR remains ~27%.
The key support is the Realized Price ($54,754). As long as price holds above it, the market formally remains above its cyclical foundation. STH MVRV 0.81 indicates that short-term holders are carrying unrealized losses of approximately 19% - the breakeven level of this cohort remains active resistance on any recovery.
Market Stress & Positioning
Exchange Netflow (7D): -22,700 BTC | State: OUTFLOW | WoW: Down (improvement)Interpretation:Net BTC outflow from exchanges declined from -39,900 BTC to -22,700 BTC - direct supply pressure on the spot market remains subdued, although outflow intensity has decreased.
STH MVRV: 0.81 | State: STRESS | WoW: Up (improvement)Interpretation:Short-term holders remain in unrealized loss territory, but STH MVRV rose from 0.758 to 0.812 - stress is easing, a full supply absorption zone has not formed.
Realized Profit/Loss Ratio: IMPROVEMENT | WoW: UpInterpretation:The share of supply in profit rose +7.0 pp over 30 days to 60.4% - the market is shifting away from a realized-loss environment, but capitulation pressure has not been fully removed.
Taker Aggression: 0.72 | State: NEUTRAL | WoW: UpInterpretation:Taker aggression rose from 0.50 to 0.72, the move is driven primarily by spot (Spot-Led Move: YES). No derivatives overheating.
Funding: NeutralInterpretation:No clear positioning skew in derivatives.
OI Momentum (7D): 0.028 | State: STABLE | WoW: DownInterpretation:OI Momentum declined from 0.440 to 0.028 - open interest is not accumulating, derivatives leverage does not create systemic risk.
Layers Analysis (Context)
L2: Supply Wall - FALSE
Facts
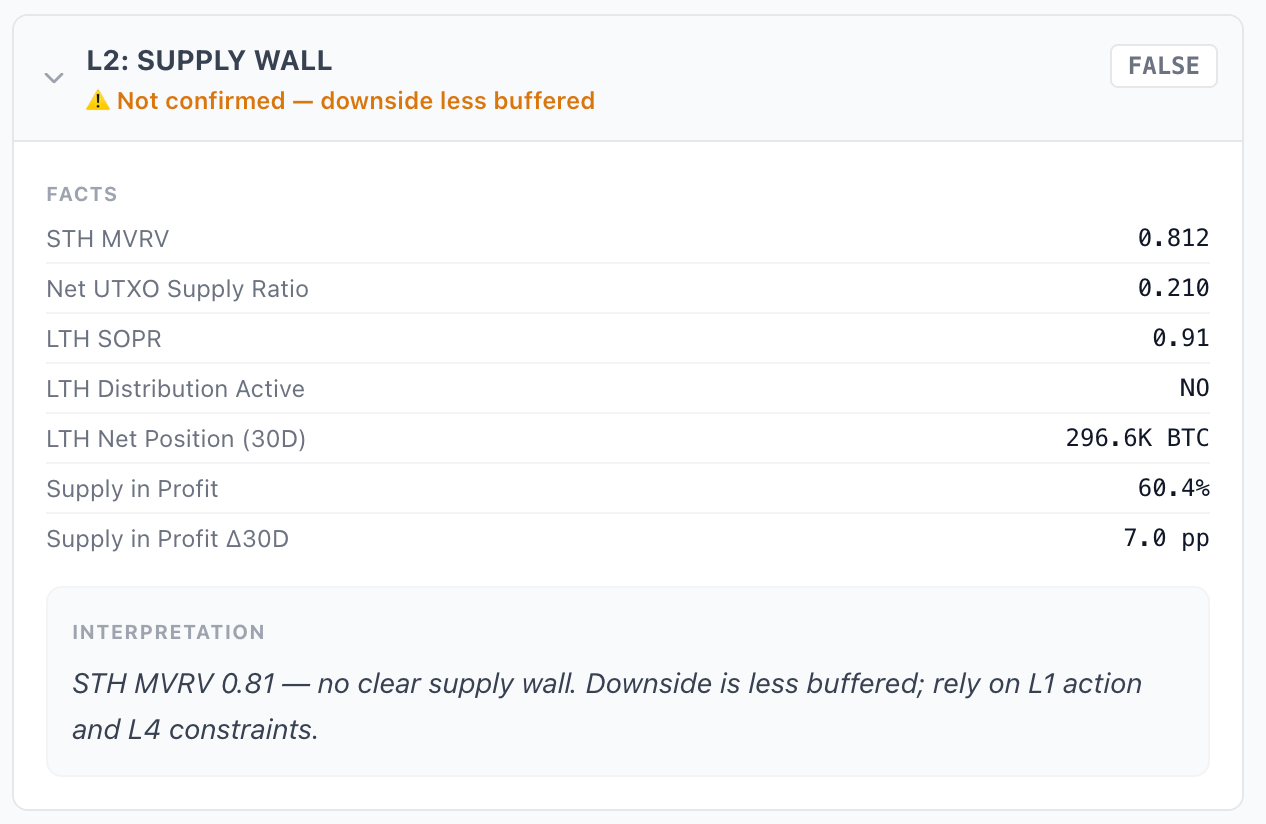
Interpretation:No confirmed supply wall. STH MVRV 0.81 - short-term holders are at a loss, structural support from below has not formed, downside remains weakly buffered. LTH SOPR 0.91 indicates that long-term holders selling under current conditions are doing so at a loss - a sign of no active distribution. LTH Net Position +296,600 BTC over 30 days - accumulation continues and has strengthened compared to last week (+278,400 BTC), however this is structural context, not confirmation of a reversal.
L3: Leverage Hot - FALSE
Facts
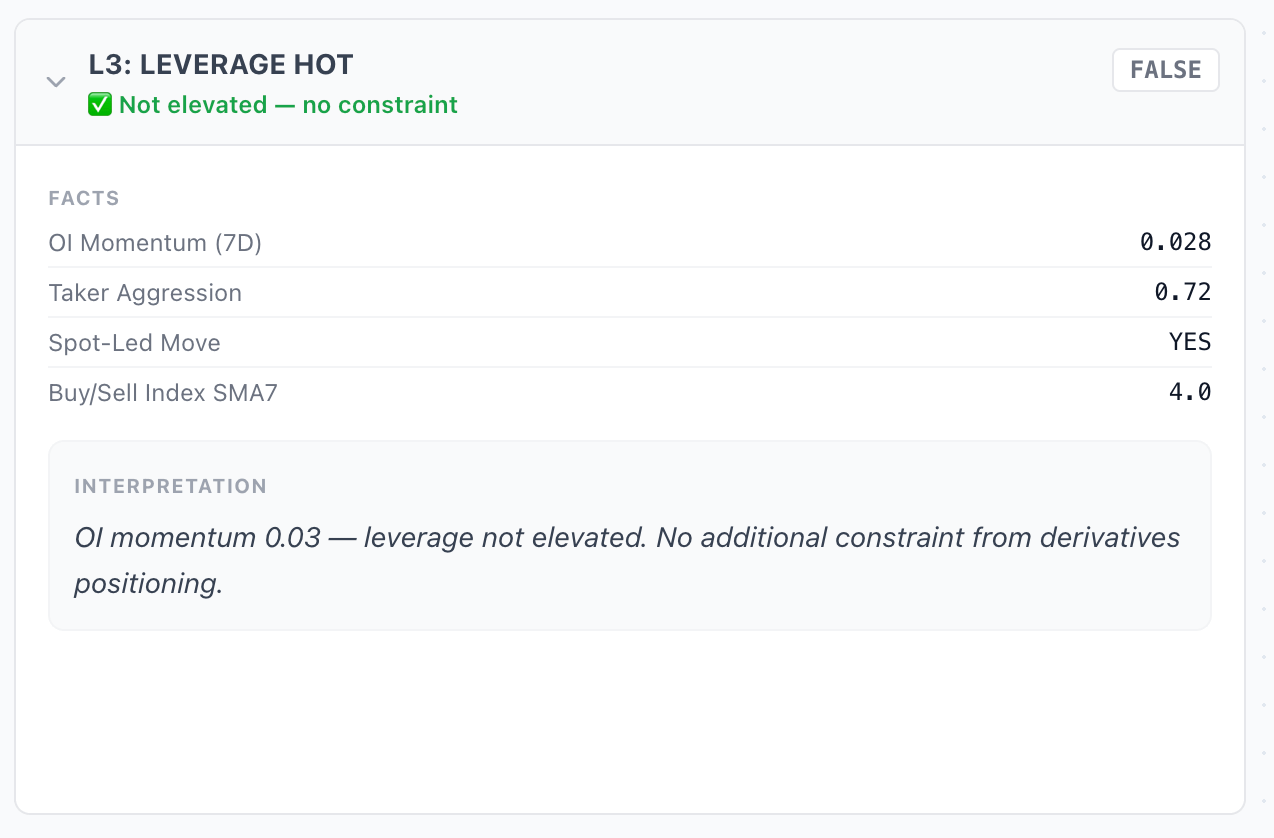
nterpretation:No constraints from derivatives positioning. OI Momentum dropped sharply from 0.440 to 0.028 - leverage is not accumulating. The +6.6% price move is spot-driven in nature, reducing the risk of forced liquidations on a pullback. L3 is neutral.
L4: Sell Pressure - FALSE
Facts
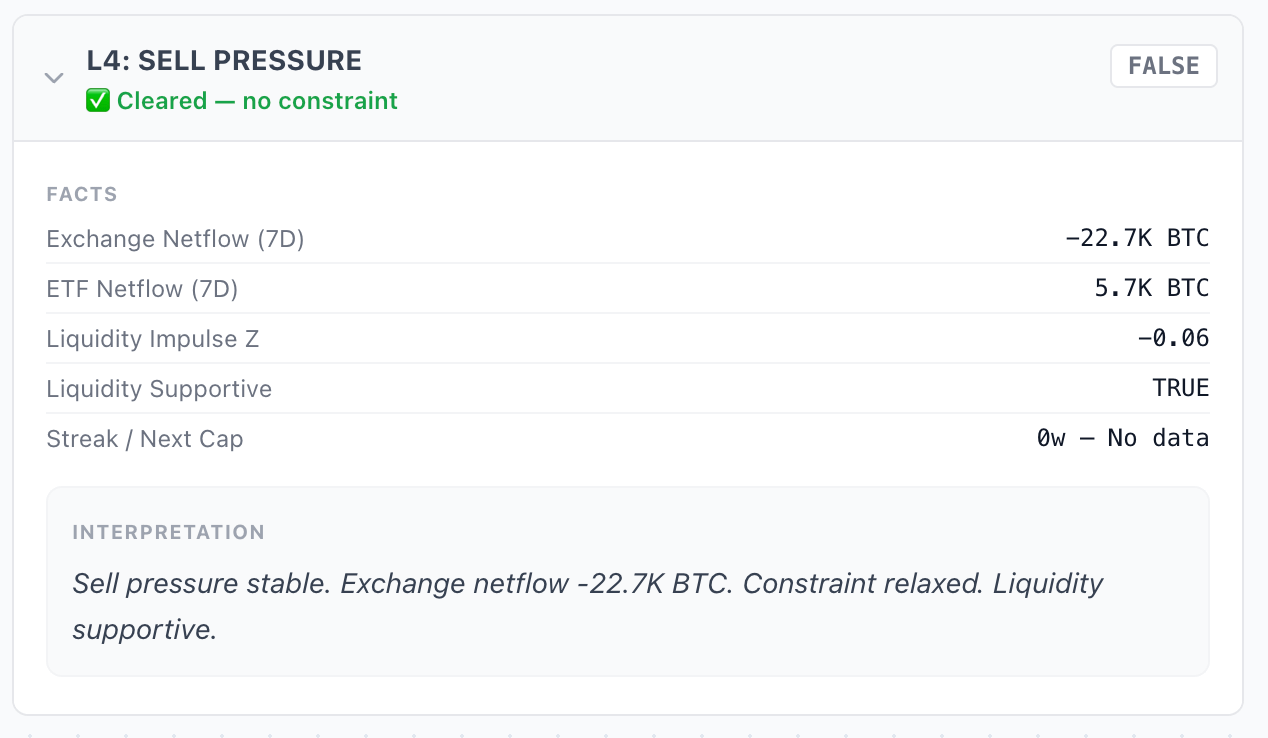
Interpretation:The sell pressure constraint remains lifted. Exchange outflow of -22,700 BTC reduces direct supply pressure. An important change compared to last week: ETF netflow returned to positive territory (+5,700 BTC) - external institutional demand has recovered, though the scale is modest. Liquidity is supportive. The removal of sell pressure indicates flow stabilization, but does not confirm a reversal.
L5: Macro - RISK-OFF
Facts
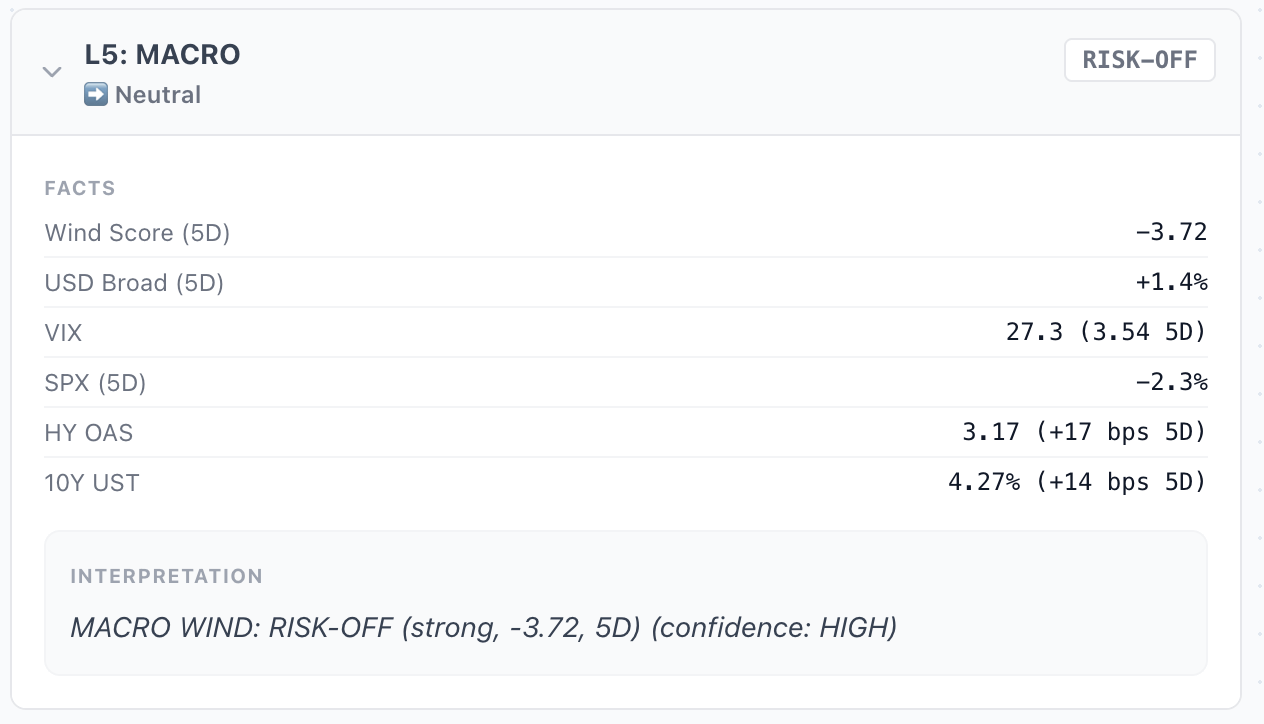
Interpretation:The macro backdrop deteriorated relative to last week: Wind Score deepened to -3.72 (vs. -3.28), VIX rose to 27.3, HY OAS widened by 17 bps, the dollar strengthened +1.4%. Risk-Off intensified - the external environment creates a tighter context for risk assets than a week ago. This is not a direct trigger for a Bitcoin decline, but an unfavorable backdrop for confirming a reversal.
L6: Breadth - NORMAL
Facts
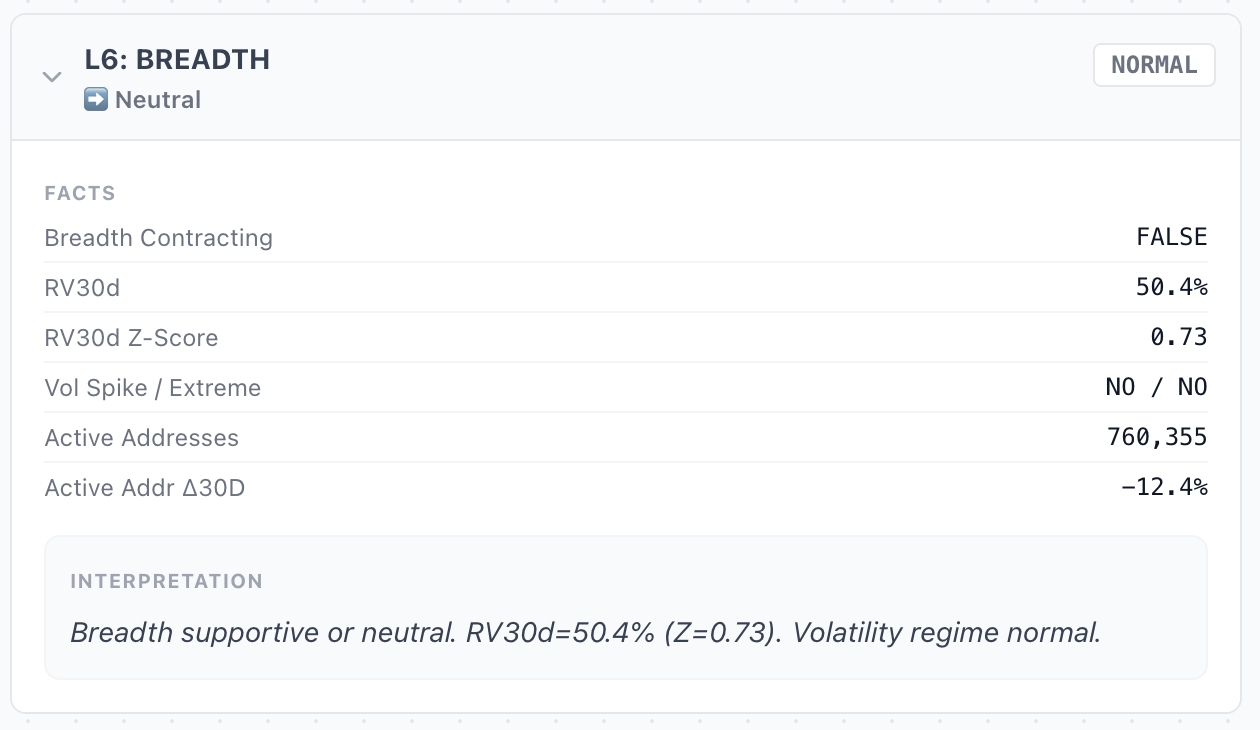
Interpretation:Breadth remains neutral. Volatility is normal: RV30d = 50.4% at Z-Score 0.73 - no extremes. Active addresses declined 12.4% over 30 days (760,355 vs. 787,439 the prior week) - network participation continues to weaken. No broad revival phase is observed.
L7: Dormancy
Facts
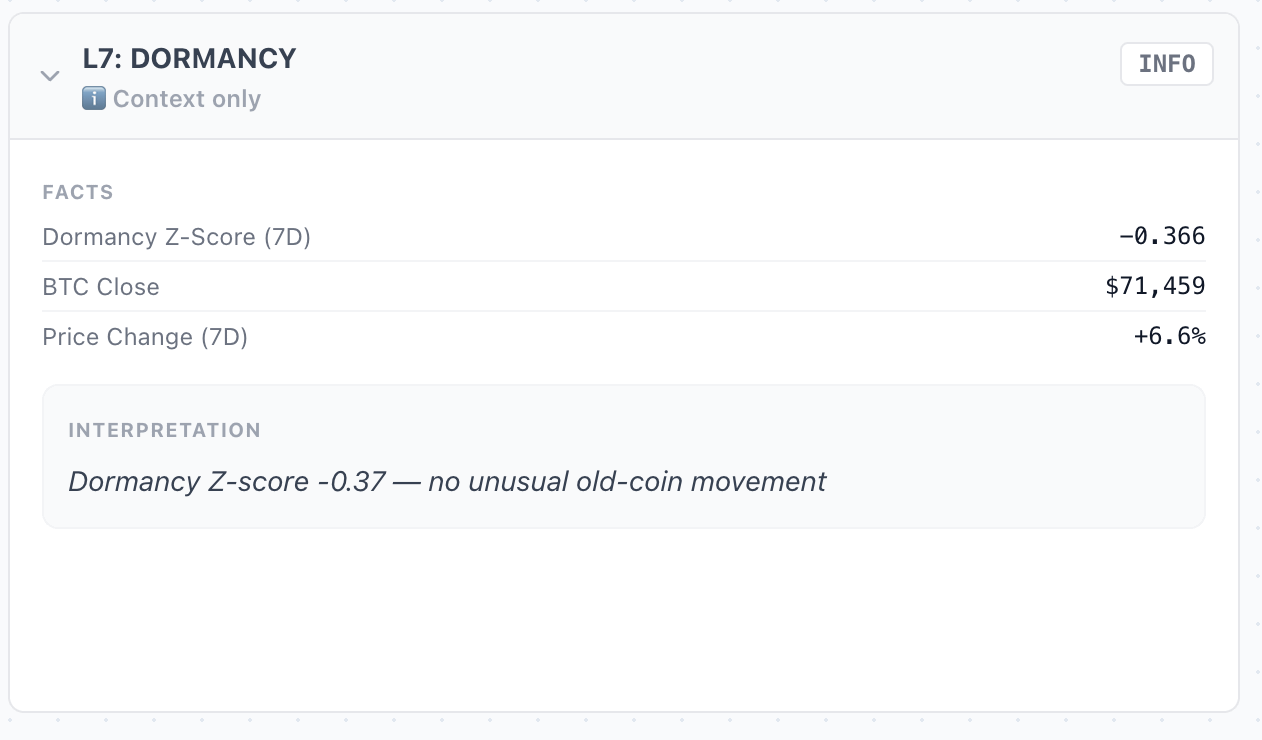
Interpretation:Dormancy Z-Score -0.37 - old coins are not moving. The +6.6% price increase is not accompanied by activation of long-dormant holders, which is consistent with the LTH accumulation picture from L2.
Drivers
Primary Drivers:
• Core regime remains BEAR and continues to block entry • STH MVRV 0.81: short-term holders in stress, supply wall not confirmed • Macro RISK-OFF intensified: Wind Score -3.72, VIX 27.3, HY OAS widening
Secondary Context:
• ETF netflow recovered to +5,700 BTC (improvement) • LTH Net Position +296,600 BTC: accumulation strengthened, but does not change the regime • Spot-Led Move + OI Momentum 0.028: move without derivatives leverage, L3 = FALSE
Flip Condition & Weekly Invalidation
Flip condition:A change in action is only possible upon confirmed transition out of the bear phase. Late Bear = TRUE - action changes to BUY DIP, cap 60% in the entry week. Bear End = TRUE - action changes to BUY, cap 100%.
Weekly invalidation:Not available.
Bottom Line
Bias remains BEAR, Weekly Engine maintains Bear - Stay Out mode (S5, 8th week of phase). Action - WAIT, cap 0%, plan unchanged.
The key state of the week - the market is neither deteriorating nor providing reversal confirmation. Compared to W-08, there was a point improvement: STH MVRV rose from 0.758 to 0.812, ETF netflow returned to positive (+5,700 BTC), price gained 6.6% on spot volume without derivatives overheating. This is a transition from deterioration to stabilization - nothing more.
No basis for entry has formed. STH MVRV 0.81 - short-term holders remain in loss territory, no confirmed supply wall, downside is weakly buffered. LTHs are accumulating actively (+296,600 BTC over 30 days), but with active BEAR L1 this is structural context, not an entry signal.
The macro context deteriorated relative to last week. Wind Score deepened to -3.72, VIX rose to 27.3, HY OAS widened - Risk-Off intensified. Bitcoin’s +6.6% move against this backdrop is interpreted as a bear market rally until a regime change is confirmed.
Summary: the market has stabilized but has not reversed. Flows have normalized, leverage is not overheated, old coins are not moving. However, L1 has not met the regime change condition, STH is in stress, macro has deteriorated. No entry.
Conclusion (W-SUN 2026-03-15)
In the week ofW-SUN 2026-03-15the Weekly Engine remains inBEAR (S5)mode:
WAIT, cap 0%, plan UNCHANGED, posture Normal.Rule:L1 core goal not reached, state = S5. No entry permitted. Remain in cash.
The key change of the week - partial flow improvement: ETF netflow returned to positive (+5,700 BTC), STH MVRV rose from 0.758 to 0.812, price gained 6.6% on spot volume. The structural regime did not change; macro deteriorated.
Why:
• L1 = BEAR (S5) - the system did not confirm an exit from the bear phase • STH MVRV 0.81 - short-term holders at a loss, supply wall absent • Macro RISK-OFF intensified - Wind Score -3.72, VIX 27.3, HY OAS widening • Price move is spot-driven, no confirmation of structural reversal • Invalidation not set - no additional protective levels established
Summary: the market transitioned from deterioration to stabilization, but not to reversal. Until Late Bear or Bear End is confirmed, any upward moves are interpreted as bear market rallies.
Weekly Plan (what we do with capital)
Action unchanged: no exposure opened, capital held in cash.
Lock #1 - Late Bear ConfirmationStructural market support must appear and L1 must transition to Late Bear state. Until then, entry is not possible (BUY DIP, cap 60% in the entry week).
Lock #2 - Bear End ConfirmationThe base regime must exit the bear state and transition to the next cycle phase (BUY, cap 100%).
Until these conditions are met, any upward moves are interpreted as bear market rallies, not the beginning of a new sustained trend.
Key Risk Control Zones
Active Resistance (AR):$91,071Active Support (RP):$54,754
The current price of $71,459 remains significantly below active resistance and in the middle of the range between support and resistance. Despite the +6.6% weekly gain, risk asymmetry persists: ~27% upside to AR, ~23% downside to RP. No structural recovery confirmation.
Want to Invest with KCE Capital?
Get access to our full portfolio management, detailed reports, and personalized investment strategies.
Become a Client