Weekly Engine
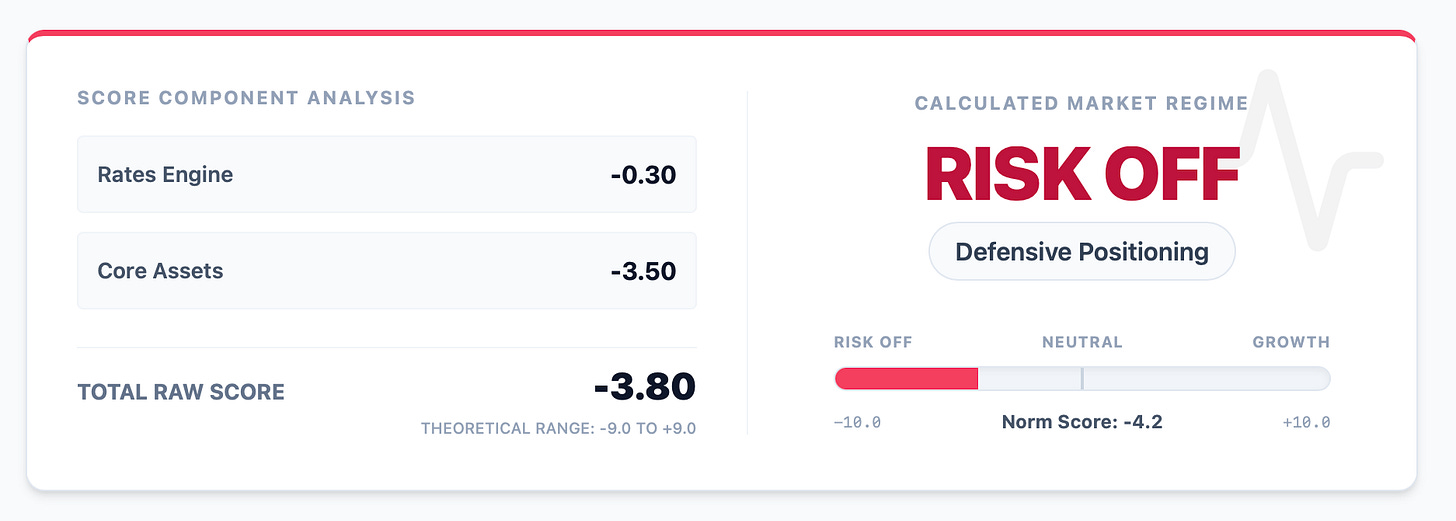
On Tuesday I wrote about problems with HYG (80.28, -0.55%), which signaled the market shifting into a 🔴RISK-OFFregime. By Friday the situation had only worsened:BlackRockwas forced to limit withdrawals f...
GM/GN.
On Tuesday Iwrote about problemswithHYG (80.28, -0.55%), which signaled the market shifting into a 🔴RISK-OFFregime. By Friday the situation had only worsened:BlackRockwas forced to limit withdrawals from its private credit fundamid mounting redemption requests.
The core concern among investors is that structural risks within the $2-trillionprivate creditmarket have begun to surface against a backdrop of global instability. Investors have effectively realized that a significant portion of capital is deployed in illiquid and risky loans. The wave of negative headlines triggered a rush to exit such instruments, but BlackRock’s withdrawal restrictions only amplified nervousness and created additional pressure across the industry.
Current risks can be reduced to several key factors: a potential rise in corporate defaults, accelerating job cuts driven by AI adoption (for example,Block Inc.announced layoffs of 4,000 employees), illiquidity issues within large private credit funds, and a broader increase in macroeconomic stress due to weak US labor market data and escalating Middle East tensions.
As a result, investors are moving to reduce exposure to risk assets and rotate capital into more defensive instruments and safe havens. Here is the current picture as of this hour.
This weekWEEKLY ENGINEreceived several updates. The key change - we split the full analysis into two blocks.
The first block- Weekly Decision Matrix. Essentially a single card showing the market status with a brief analyst comment explaining the current state. You no longer need to read the entire report to understand the market situation - 30-40 seconds on the first block is enough.
Thank you for your comments and feedback - they are exactly what drives us to make the product clearer and more user-friendly.
The second block- Trader’s Evidence (deep analytics). It is designed for traders and analysts who need a deeper level of analysis and understanding of cause-and-effect relationships in the market. Inside this block we have added visual markers - 🔴 Blocks entry, ⚠️ Not confirmed, ✅ Cleared and others. They help you navigate the data faster and simplify working with the analytics.
This week several positive catalysts for Bitcoin emerged simultaneously.Morgan Stanleyfiled an application to launch a spot bitcoin ETF,Krakenbecame the first digital asset bank, the state ofIndianasigned a law allowing state pension funds to invest in bitcoin. In addition, theUS Presidentcalled for accelerating the passage of digital asset market structure legislation (Clarity Act).
In parallel, many large asset managers and investment firms increased their positions in$MSTRshares, and market data also began to show the first signs of stabilization - well reflectedin the morning briefs☕️ ADLER AM:ETF Flows Show First Recovery Signal,Bear Regime Losing Control,Outflow BTC from Exchanges.
However, all of this positive momentum was effectively negated by the end of the week against the backdrop of the global 🔴RISK-OFFregime.
The crypto-positive this week was real.ETF approvals, regulatory news, and capital inflows began to shift market sentiment.
ButWeekly Engine does not read headlines- it analyzes market structure.
And right now that structure is telling a completely different story.
The full breakdown is in the report below.
Weekly Decision Matrix
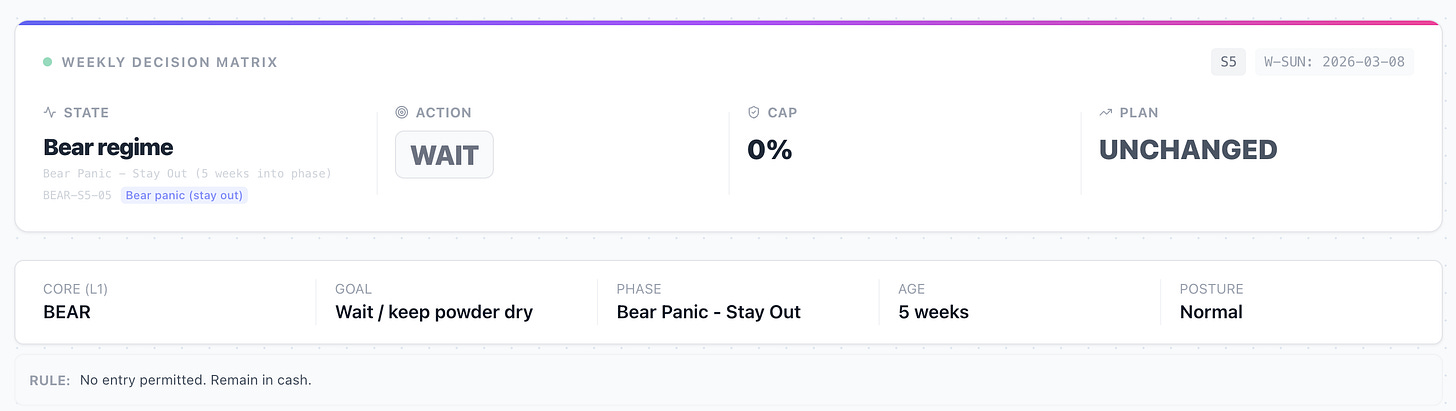
This week the strategy remains out of the market - position0%, no new purchases. At the close of the week the market is in a panic sell-off andRisk-OFFregime, under which system rules do not permit entry regardless of short-term price movements. We will only revisit entry once the system confirms a sustained regime change.
✋ If you do not need a deeper analysis,you can stop reading here- what follows is a detailed breakdown of market structure and the reasons behind the current system decision.
—🙅♂️ End Weekly Decision Matrix
Trader’s Evidence (deep analytics)
Weekly Market Report: Bitcoin On-chain & DerivativesWeek end date: 2026-03-08 (Cayman Islands)Reference price: $67,531Market Bias: Caution STH-RPStatus: Below
On-chain Level Map
Active Support:$54,754 (Source: RP - Realized Price)Active Resistance:$91,071 (Source: STH-RP / STH Cost Basis)
STH Cost Basis:$91,071LTH Cost Basis:$38,896Realized Price:$54,754
Level Interpretation:The price of$67,531remains below the short-term holder cost basis (STH Cost Basis = $91,071), keeping that level asactive resistance (AR)and a potential distribution zone on any rally.
The key market support is unchanged -Realized Price ($54,754). As long as price holds above it, the market formally remains above the cyclical foundation. Below sitsLTH Cost Basis ($38,896)as the long-term capital anchor.
Market Stress & Positioning
Exchange Netflow (7D): -39.9K BTC | State: OUTFLOW | WoW: upInterpretation:net BTC outflow from exchanges has increased - direct supply pressure remains subdued.
STH MVRV: 0.758 | State: STRESS | WoW: unchangedInterpretation:short-term holders are still underwater. Stress persists, a full supply absorption zone has not formed.
Realized Profit/Loss Ratio: LOSS-DOMINANT | WoW: unchangedInterpretation:the market is still closer to a realized-loss environment than a sustained profit-taking phase. Capitulation pressure has eased but is not fully removed.
Taker Aggression: 0.50 | State: BALANCED | WoW: upInterpretation:buyer and seller activity has become more balanced. The market shows no pronounced impulse from aggressive demand.
Funding: NeutralInterpretation:no notable positioning skew in derivatives.
OI Momentum (7D): +0.440 | State: STABLE | WoW: upInterpretation:open interest is growing moderately with no signs of overheating. Leverage has returned but is not yet creating systemic risk.
Layers Analysis (Context)
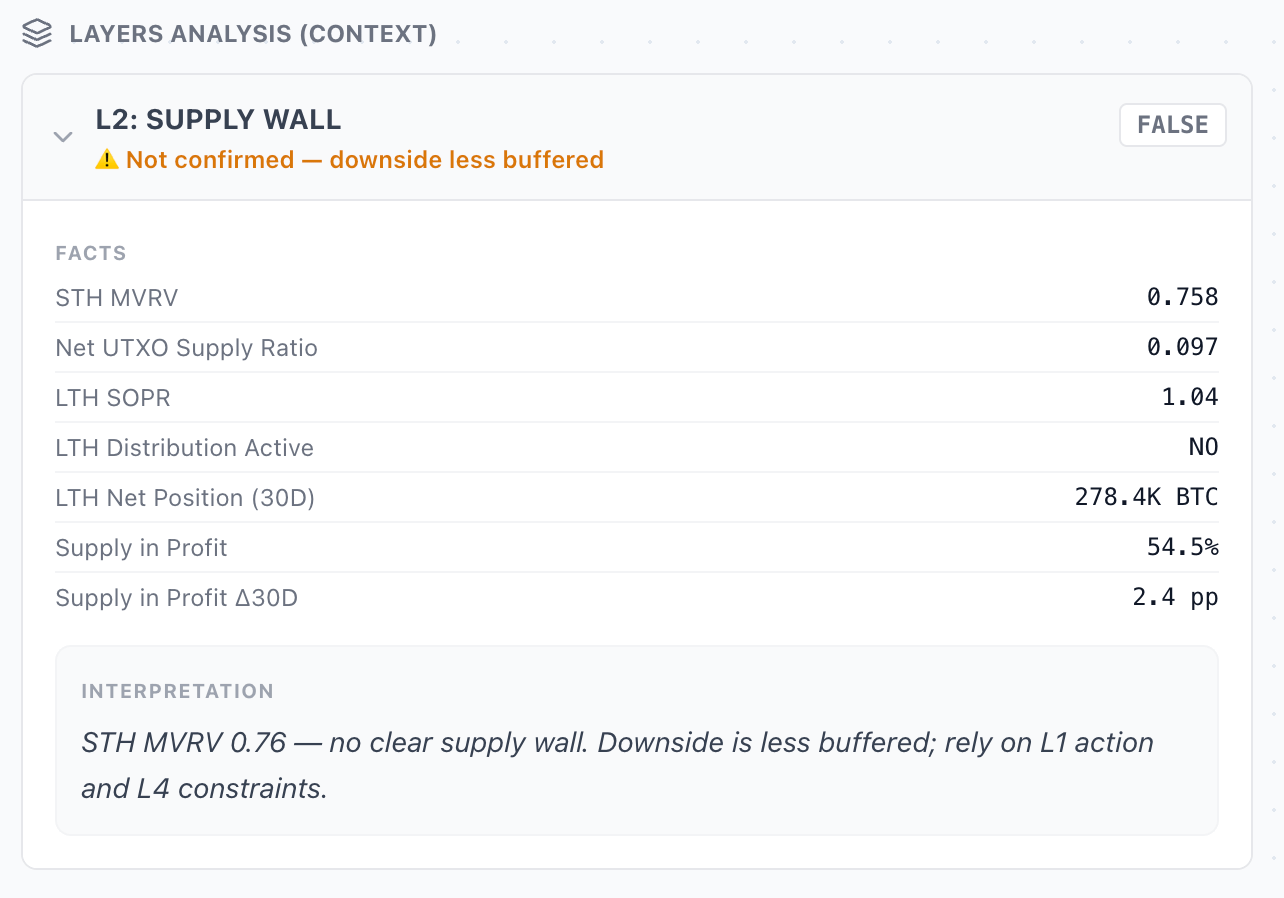
L2: Supply Wall - FALSE
Facts
STH MVRV:0.758Net UTXO Supply Ratio:0.097LTH SOPR:1.04LTH Distribution Active:NOLTH Net Position (30D):+278.4K BTCSupply in Profit:54.5%Supply in Profit D30D:+2.4 pp
Interpretation:Despite continued accumulation by long-term holders (LTH Net Position +278.4K BTC), a confirmedsupply wallhas still not formed. Short-term holders remain in a stress zone, so the lower end of the range stays weakly buffered. This is no longer deterioration, but it is not a confirmed reversal base either.
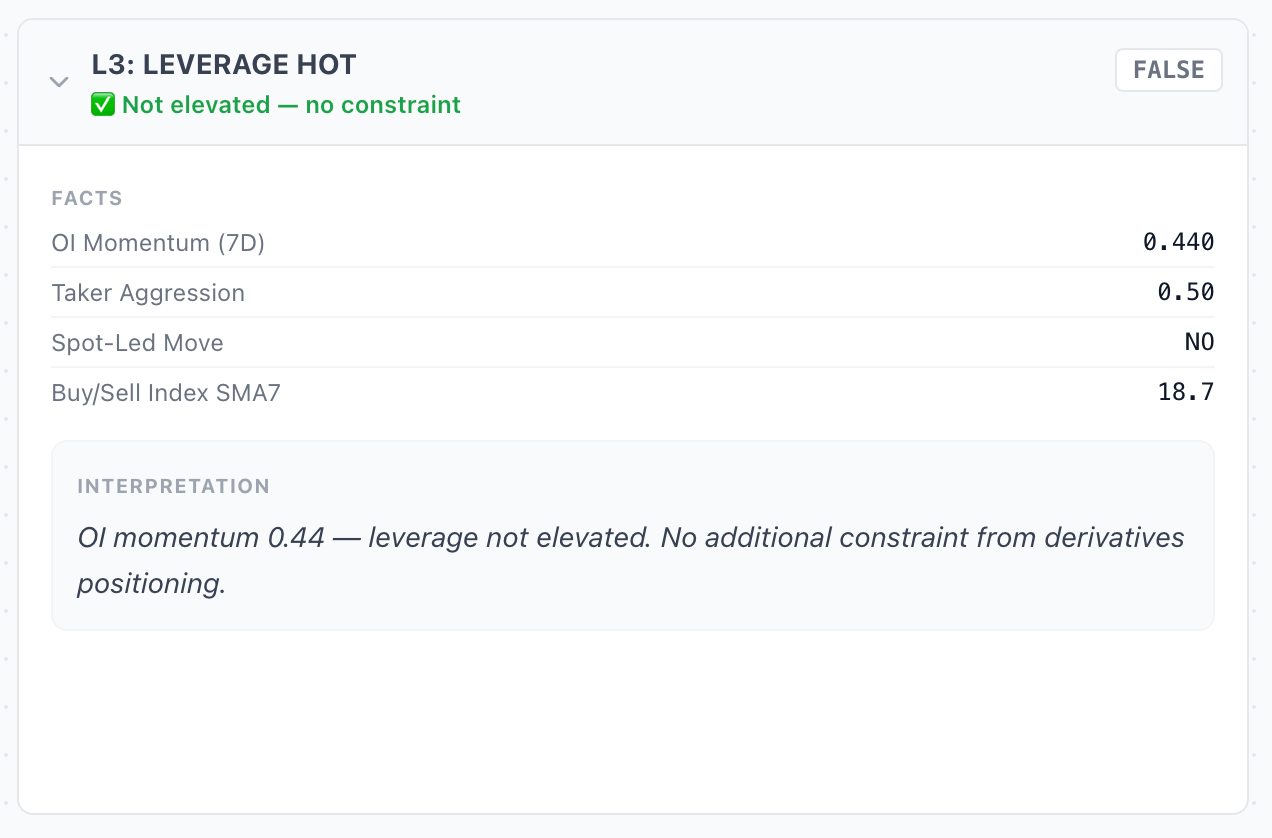
L3: Leverage Hot - FALSE
Facts
OI Momentum (7D):0.440Taker Aggression:0.50Spot-Led Move:NOBuy/Sell Index SMA7:18.7
Interpretation:Derivatives leverage is not overheated. Open interest growth is moderate, meaning the market is not entering a dangerous leverage saturation phase. No constraints from derivatives, but no strong spot leadership either.
L4: Sell Pressure - FALSE
Facts
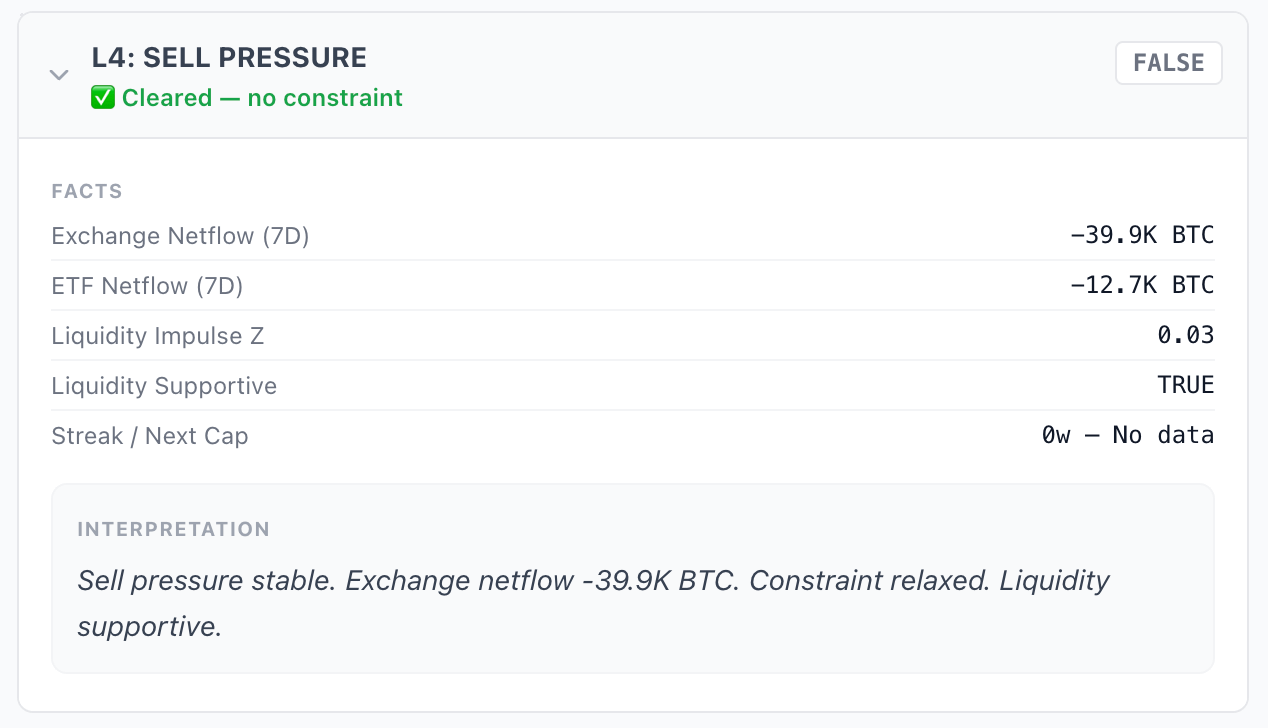
Exchange Netflow (7D):-39.9K BTCETF Netflow (7D):-12.7K BTCLiquidity Impulse Z:0.03Liquidity Supportive:TRUE
Interpretation:Sell pressure remains stable and is not building:
• BTC continues to leave exchanges • the L4 constraint remains cleared • liquidity is mildly supportive
But the key difference from last week is thatETF flows have turned negative again (-12.7K BTC). This weakens external demand, though it has not yet returned the market to a mode of active supply accumulation.
L5: Macro - RISK-OFF 🔴
Facts
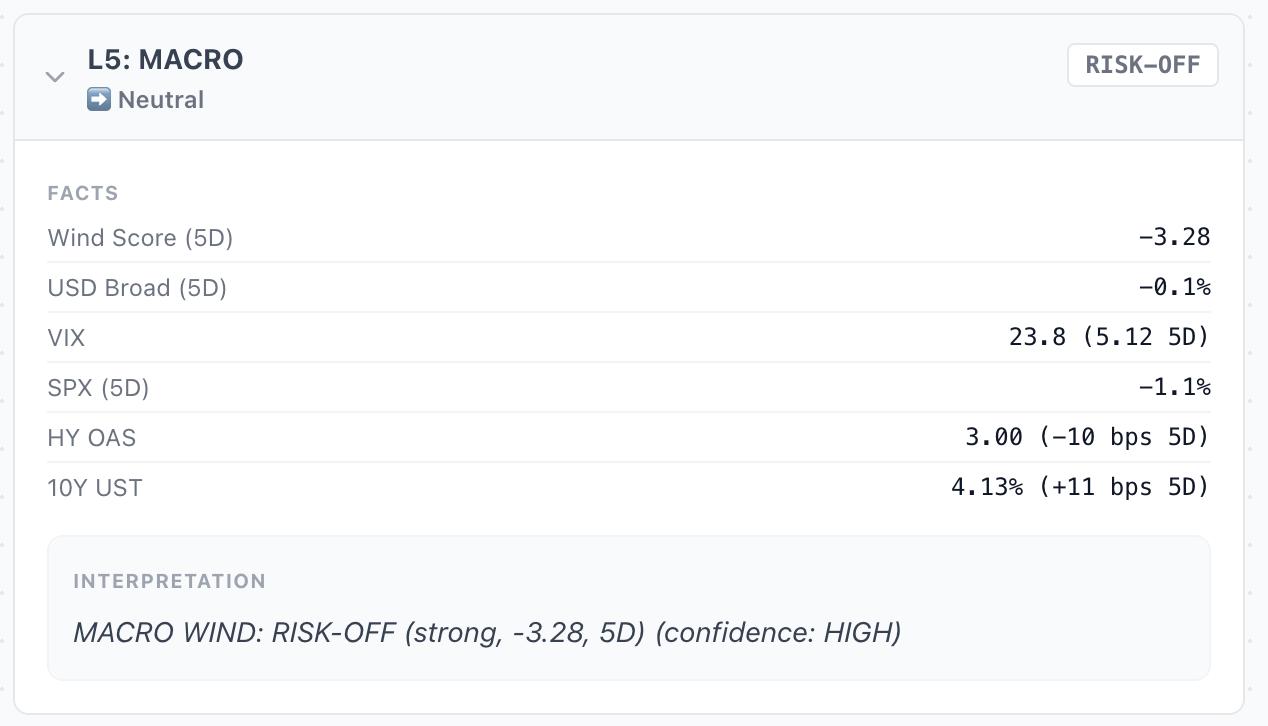
Wind Score (5D):-3.28USDBroad (5D):-0.1%VIX:23.8SPX (5D):-1.1%HY OAS:3.0010Y UST:4.13%
Interpretation:The macro backdrop has deteriorated and shifted intoRisk-Off. Rising VIX, declining SPX, and a weak overall macro wind create a more adverse external environment for risk assets. This is not yet a direct trigger for Bitcoin weakness, but it is an unfavorable context for launching a sustained reversal.
L6: Breadth - NORMAL
Facts
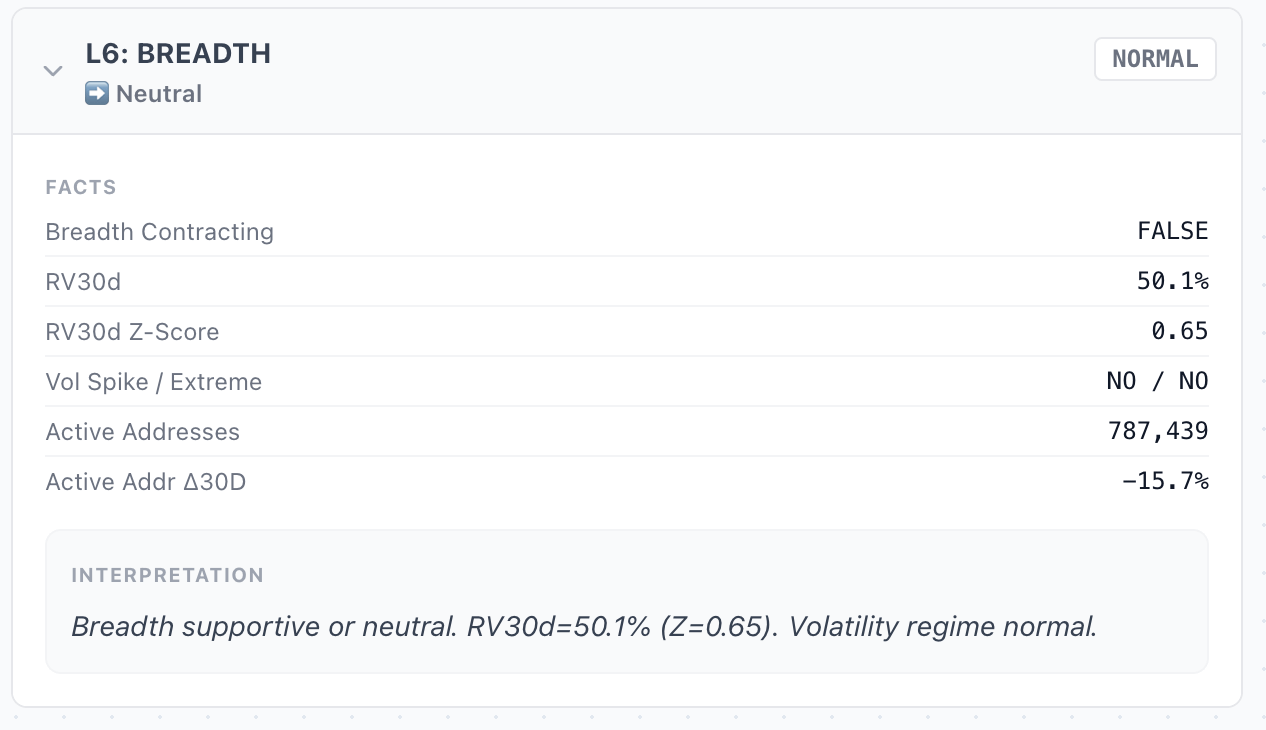
Breadth Contracting:FALSERV30d:50.1%RV30d Z-Score:0.65Vol Spike / Extreme:NO / NOActive Addresses:787,439Active Addr D30D:-15.7%
Interpretation:Breadth remains neutral. Volatility is no longer extreme, but network participation has weakened: active addresses declined noticeably over 30 days. This suggests the market has stabilized, but a broad recovery phase has not yet begun.
L7: Dormancy
Facts
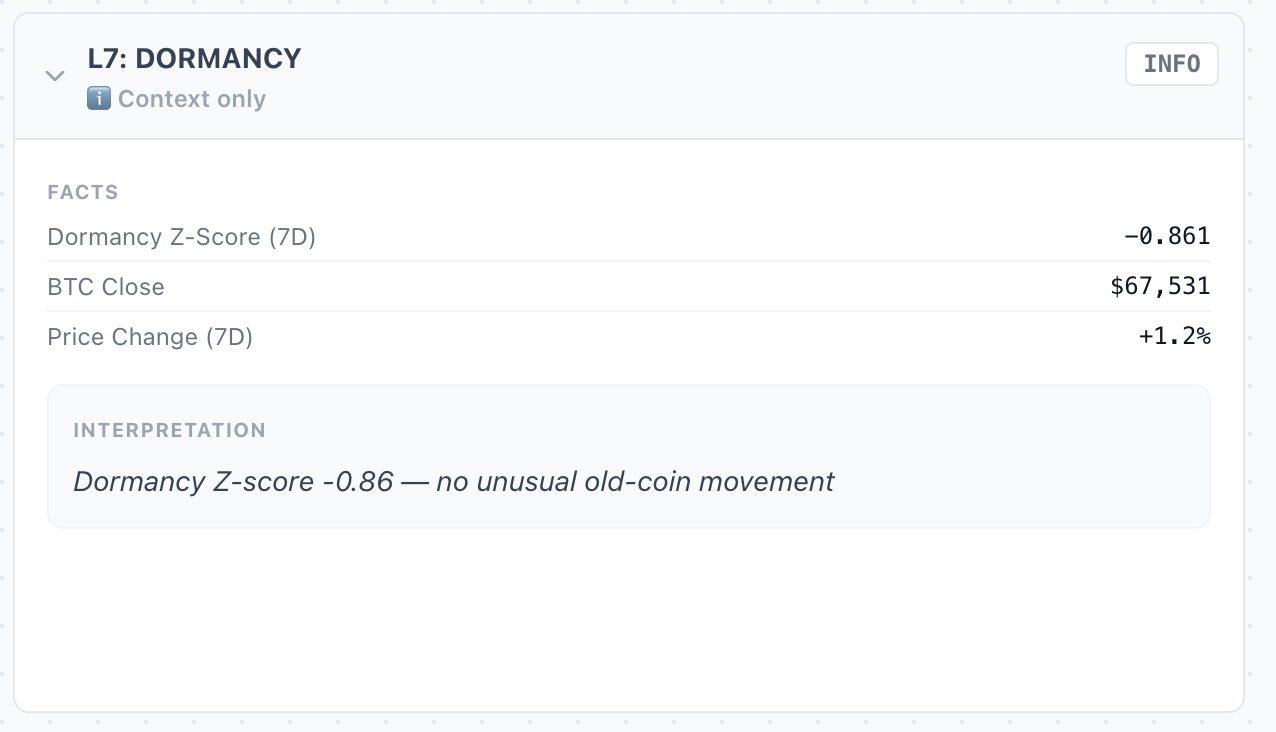
Dormancy Z-Score (7D):-0.861BTC Close:$67,531Price Change (7D):+1.2%
Interpretation:Old coins remain inactive. This means that even with a modest price increase, long-term holders are not moving toward mass distribution.
Drivers
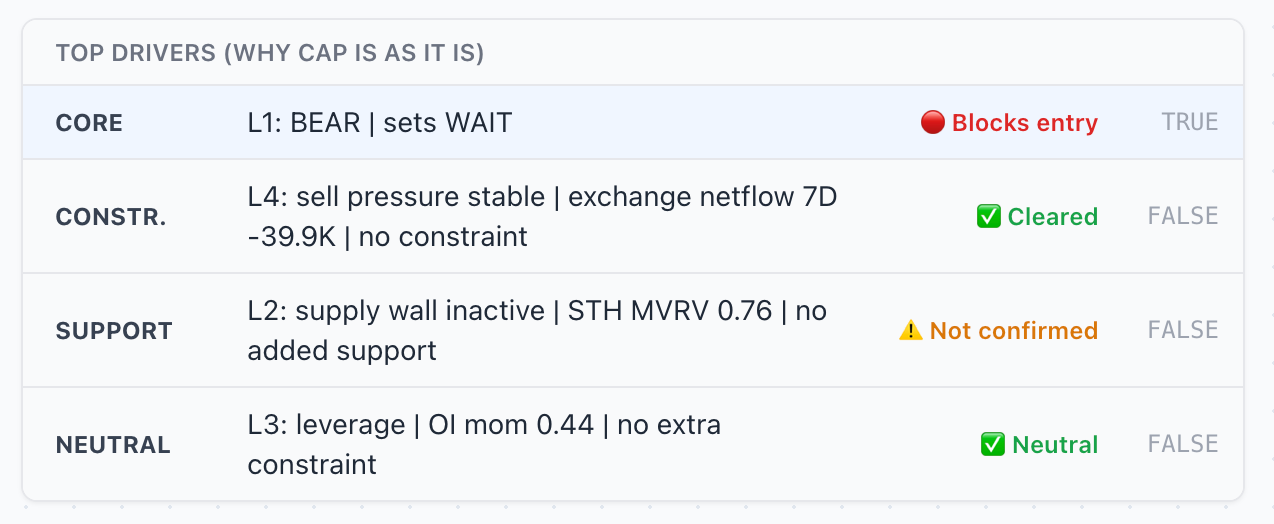
Primary Drivers:
• Core regime remainsBEARand continues to block entry • Sell pressure remains stable and does not create a new constraint • STH valuation remains in stress • Leverage is not elevated
Secondary Context:
• ETF flows turned negative again • Liquidity remains mildly supportive • Macro shifted into Risk-Off • Breadth is neutral, not expanding
Flip Condition & Weekly Invalidation
Flip condition:A change of action is only possible if the market confirms a transition out of the bear phase into a later stage of the cycle.
• Late bear = TRUE-> action changes toBUY DIPwith a cap of60%on the entry week • Bear end = TRUE-> action changes toBUYwith a cap of100%
Weekly invalidation:Not available
Bottom Line
BiasremainsCautionandWeekly Enginemaintains theBear - Stay Outregime.
The key takeaway for the week - the marketis not deteriorating, butis not confirming a reversaleither. Supply pressure is still not growing: BTC is leaving exchanges, liquidity remains neutrally positive, and derivatives leverage is not creating new risk. This keeps the market in a stabilization phase.
But the base for entry has still not formed.STH MVRV ~0.76remains in the stress zone, a confirmed supply absorption zone does not exist, andETF flows have turned negative again. Additionally, the macro backdrop has shifted towardRisk-Off, worsening the external context for risk assets.
In other words:pressure is not growing, but there is still no structural foundation for buying.
The key support level remainsRealized Price $54,754. As long as the market is trading belowSTH Cost Basis $91,071, any recovery moves are statistically part of the bear market regime - not a confirmed new trend.
Conclusion (W-SUN 2026-03-08)
In weekW-SUN 2026-03-08Weekly Engine remains inBear - Stay Outmode:
The key change of the week - the market maintained stabilization, but the quality of external demand weakened due to negative ETF flows and a deteriorating macro backdrop.
Why:
• L1 (core regime) = BEAR-> the primary blocking factor is unchanged • L4 (sell pressure) = FALSE-> supply pressure is not growing, constraint cleared • L2 (supply wall) = FALSE-> structural support zone not confirmed • L3 (leverage) = FALSE-> leverage is not overheated, but this is neutral, not bullish • Macro = Risk-Off-> external backdrop has worsened • Breadth = neutral-> participation is insufficient to confirm a recovery
In summary: the market remains in an intermediate phase ofstabilization within the Bear regime, but Weekly Engine still requires confirmation ofLate Bearor a fullBear Endbefore entry.
Weekly Plan (what we do with capital)
No change to action:we do not open exposure, capital stays in cash.
Lock #1 - Late Bear confirmationStructural market support must appear, making the supply wall active.
Lock #2 - Bear End confirmationThe core regime must exit the bear state and transition to the next phase of the cycle.
Until these conditions are met, any upward moves are treated asbear market rallies, not the beginning of a new sustained trend.
Key Risk Control Levels
Active Resistance (AR):$91,071Active Support (RP):$54,754
The current price of$67,531remains noticeably below active resistance and closer to cyclical support than to a confirmed recovery zone. The risk asymmetry persists.
Keiondrae & Team
Want to Invest with KCE Capital?
Get access to our full portfolio management, detailed reports, and personalized investment strategies.
Become a Client